Step 14: Logs & Diagnostics
Monitor service health, debug protocol communications, and troubleshoot script execution.
Full reference
For complete details, field tables, and limitations, see the Logs & Diagnostics reference.
Understanding ControlBird's Logging System
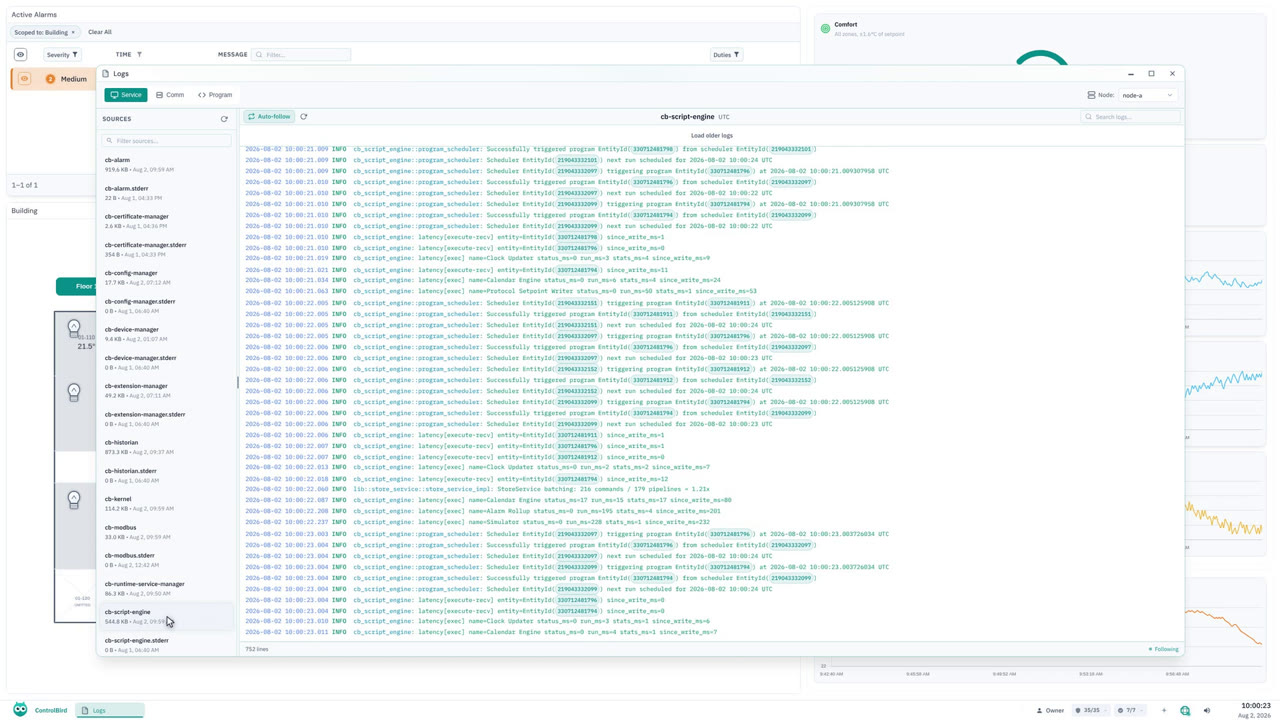
ControlBird maintains logs at multiple levels, from low-level service operations to protocol communications to script execution. These logs are essential for troubleshooting, performance monitoring, and understanding system behavior.
Service Logs
Core system services: kernel, web server, protocol handlers, script engine
Communication Logs
Protocol TX/RX data: Modbus transactions, OPC UA sessions, MQTT messages, DNP3 frames
Program Logs
Script output: console.log() messages, execution status, errors
Viewing Instance Logs in Control Plane
The Control Plane provides a quick way to view recent logs for any node. Navigate to your node's detail page and expand the Instance Logs section.
Admin Access Required
Instance logs are only visible to users with Admin or Support roles. Regular operators won't see this section. This protects sensitive system information while still allowing troubleshooting access for those who need it.
Service Logs
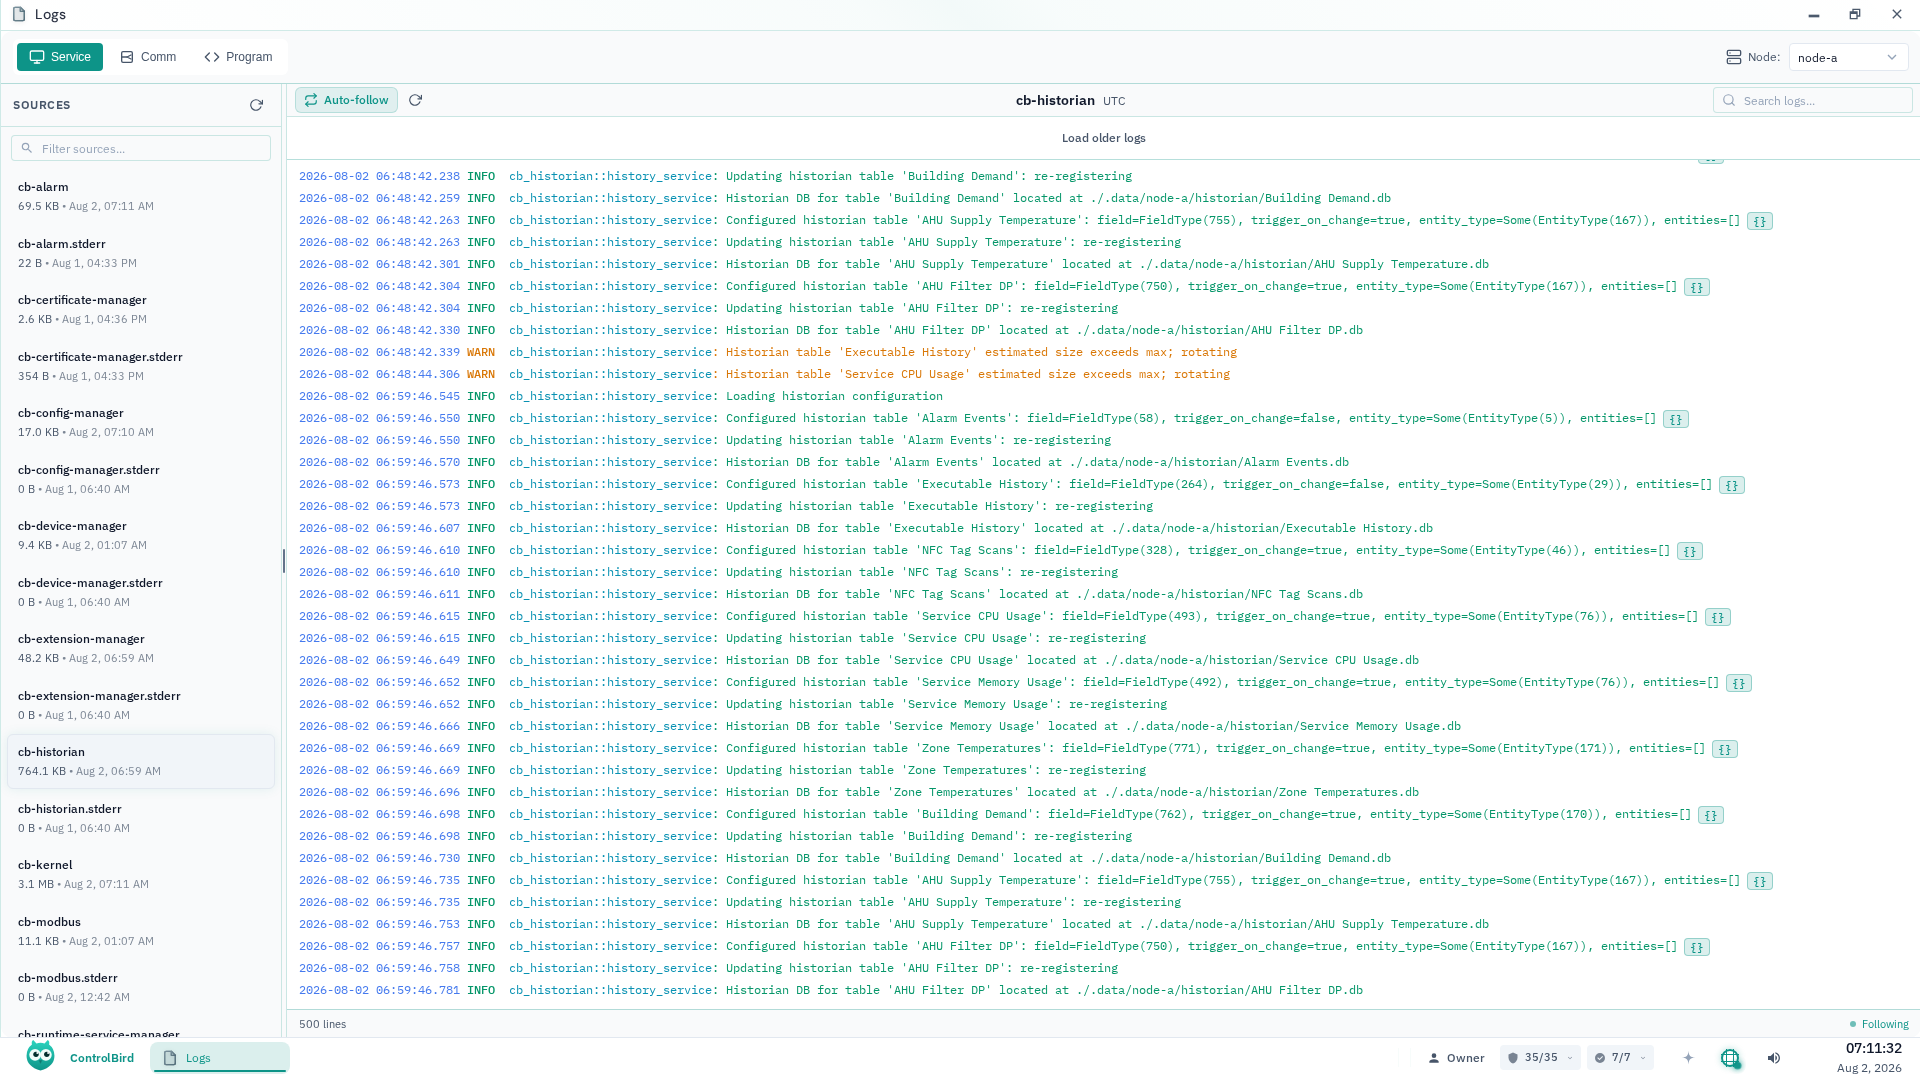
Each ControlBird service writes structured logs to its own file. These logs track service startup, configuration changes, errors, and operational events.
Log File Organization
Service logs are stored in the node's data directory, organized by service name:
Log Format
Every service log line carries a timestamp, a severity level, a message, and any details as key=value pairs. Services log at the INFO level and above:
time=2026-01-30T15:23:45.123Z level=INFO msg="kernel requested a full sync" peer=node-b
time=2026-01-30T15:23:46.456Z level=INFO msg="kernel served a full sync" peer=node-b sync=7 chunks=12 bytes=1843200
time=2026-01-30T15:24:12.789Z level=WARN msg="kernel checkpoint failed" error="no space left on device"Log Rotation
The kernel log rotates automatically to prevent unbounded disk usage:
| Setting | Default | Description |
|---|---|---|
| Max File Size | 10 MB | Log rotates when file reaches this size |
| Max Files | 5 | Number of rotated files to keep |
When the kernel log reaches the size limit, it is rotated and a new file is started. The oldest files beyond the retained count are automatically deleted.
Communication Logs
Protocol endpoints can log all transmitted and received data, which is a great help when debugging device communication issues.
Enabling Communication Logging
Each endpoint has logging controls in the Database Browser:
Communication Log Format
Communication logs show each transmitted (TX) and received (RX) message with timestamps. For binary protocols like Modbus, data is displayed in hexadecimal:
[2024-01-30 15:23:45.123] [TX] 01 03 00 00 00 0A C5 CD
[2024-01-30 15:23:45.156] [RX] 01 03 14 00 64 00 C8 01 2C ...
[2024-01-30 15:23:46.123] [TX] 01 06 00 10 00 32 C9 C3
[2024-01-30 15:23:46.145] [RX] 01 06 00 10 00 32 C9 C3
For text-based protocols like MQTT, messages are shown as readable text:
[2024-01-30 15:23:45.123] [TX] SUBSCRIBE sensors/temperature/#
[2024-01-30 15:23:45.234] [RX] SUBACK
[2024-01-30 15:23:46.456] [RX] PUBLISH sensors/temperature/living-room {"value": 72.5}
Bandwidth Monitoring
Each endpoint also tracks cumulative bandwidth usage in real-time fields:
These counters are useful for monitoring bandwidth consumption, detecting communication issues, and capacity planning.
Dynamic Configuration
Communication logging can be toggled without restarting services. Changes to the Logging field take effect immediately, which is handy for temporary debugging without generating excessive log data.
Program Logs
Scripts running in the Script Engine capture all console.log() output to individual log files, plus track execution status in entity fields.
Viewing Script Output
In the Script Manager app, click on any program and select the Log tab to see its output:
Console Methods
Scripts support standard console methods with different severity levels:
// Standard logging
console.log("Processing started");
console.log("Temperature:", store.read('/Sensors/Temp1/Value'));

// Warnings (non-critical issues)
console.warn("Sensor offline, using cached value");

// Errors (critical problems)
console.error("Failed to write to device:", error.message);
Execution Status Fields
Every Program entity tracks execution metrics in real-time fields:
Result of the most recent execution
Error message if last execution failed
Running totals for monitoring script health
When the script last ran
Log File Location
Program logs are stored in data/{node}/service-logs/programs/, one file per program named by its entity id. Each keeps up to five 1 MB files. For long-running programs with frequent logging, write to standard output sparingly in production.
Diagnostic Workflow
When troubleshooting issues, work through these log sources systematically:
Check Service Logs
Start with the relevant service log for errors or warnings
Check:
modbus-mapper.log for connection errors Enable Communication Logging
If service logs look normal, capture the actual protocol traffic
Logging to EnabledCheck: TX/RX patterns for malformed messages
Review Program Logs
For automation issues, check script execution status and output
LastExecutionStatus and LastError fieldsReview: Program log for unexpected behavior
Check Entity State
Use Database Browser to verify entity values and status fields
Check: Byte counters for communication activity
Common Issues & Solutions
Device shows "Offline" but was working earlier
- Check the endpoint's
TotalBytesRx: if it is not increasing, no data is arriving - Enable communication logging and look for timeout patterns
- Check
modbus-mapper.logfor connection errors - Verify network connectivity (ping the device IP)
- Check if the device was powered off or lost network
Script runs but doesn't produce expected results
- Check
LastExecutionStatus: is it "Success" or "Error"? - If "Error", read
LastErrorfor the specific problem - Add
console.log()statements to trace execution flow - Verify entity paths are correct (paths are case-sensitive)
- Check the program's Log tab for your debug output
Communication log shows garbled or unexpected data
- Baud rate mismatch: Verify serial settings match the device
- Wrong protocol: Ensure endpoint type matches device (Modbus RTU vs TCP)
- Address conflict: Check for duplicate device addresses on the bus
- Electrical noise: For serial connections, check cabling and termination
Service log shows "Connection refused" errors
- Firewall: Check that the port is open on both ends
- Wrong IP/port: Verify the endpoint configuration
- Service not running: The target device's service may be stopped
- Max connections: Some devices limit concurrent connections
Where are log files stored for self-hosted deployments?
All logs are stored under the node's data directory:
- Service logs:
$DATA_DIR/$NODE_ID/service-logs/ - Communication logs:
$DATA_DIR/$NODE_ID/comm-logs/ - Program logs:
$DATA_DIR/$NODE_ID/service-logs/programs/
Default: ./.data/node-a/
Environment Variables
For self-hosted deployments, these environment variables control how the kernel log rotates:
| Variable | Default | Description |
|---|---|---|
LOG_MAX_FILE_SIZE_MB | 10 | Kernel log rotation size |
LOG_MAX_FILES | 5 | Kernel log file retention count |